In a recent publication, I employed spatially resolved absorption spectroscopy to visualize inhomogeneities in n-doped donor-acceptor copolymer films. The project was spearheaded by the groups of Ryan Chiechi and Jan Anton Koster, who investigated how the position of polar sidechains influences the material’s thermoelectric performance.
While I recommend reading the whole paper, let me take this occasion to show the beauty of spatially resolved spectroscopy. Our optical setup employs various high-quality optics to focus and collect light from spots as small as 500nm (the Abbe diffraciton limit). This allows us to map a certain absorption spectrum to the corresponding spot on a sample, and compare the spectra of various spots.
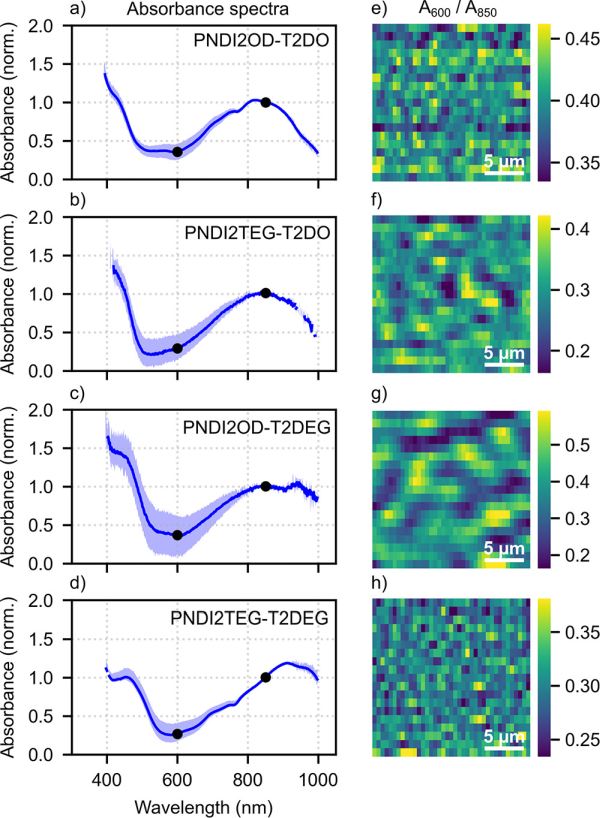
In the left column of the figure below (taken straight from the paper), I compare the absorption spectrum of four samples. As thick blue line, I show the average absorption spectrum found on a 20x20µm region of the sample. However, the absorption spectrum in this region actually varies, which is shown with the blue shadows in a)-d). You can see that the spectra in figure c) show the largest spatial variation.

Figure: (a−d) Average spatially resolved absorption spectra of doped copolymer films (thick blue line) and spectral variations (blue shaded area). (e−h) 20×20 μm maps of the absorption ratio A600/A850. Adopted without changes from the publication of Gang Ye et al., under CC BY-NC-ND 4.0 license
You may notice how the (normalized) spectra show the largest deviations at around 600nm. I therefore extracted the


